We built the analytics platform their categories run on.
For an FMCG supplier.

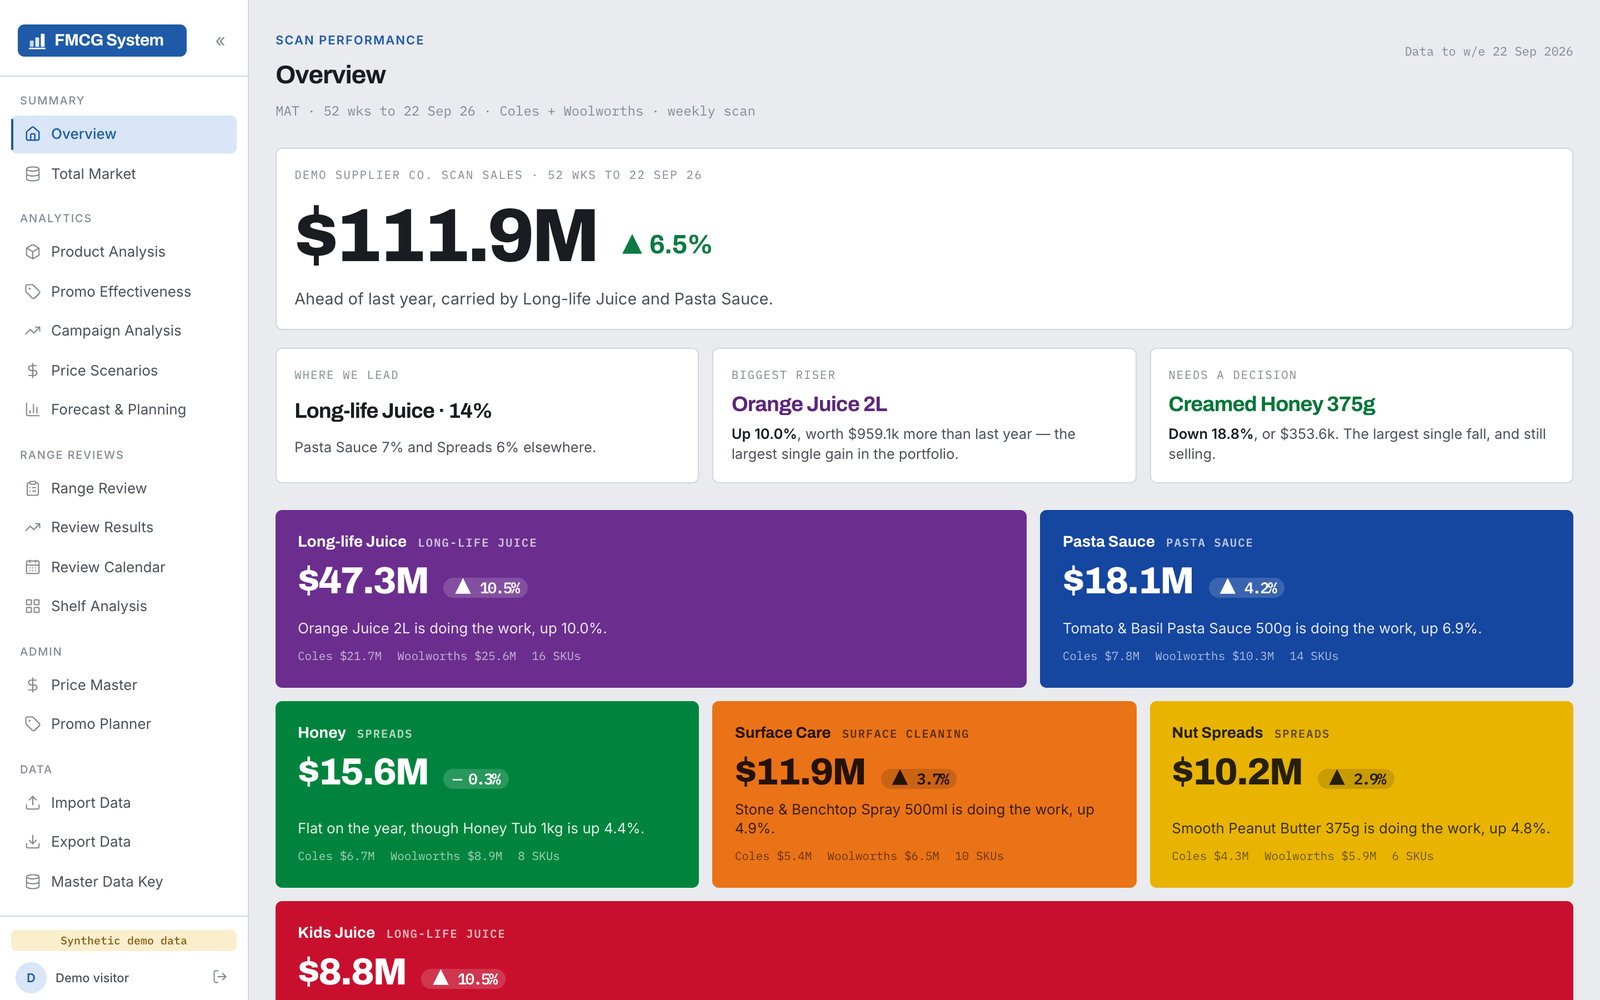
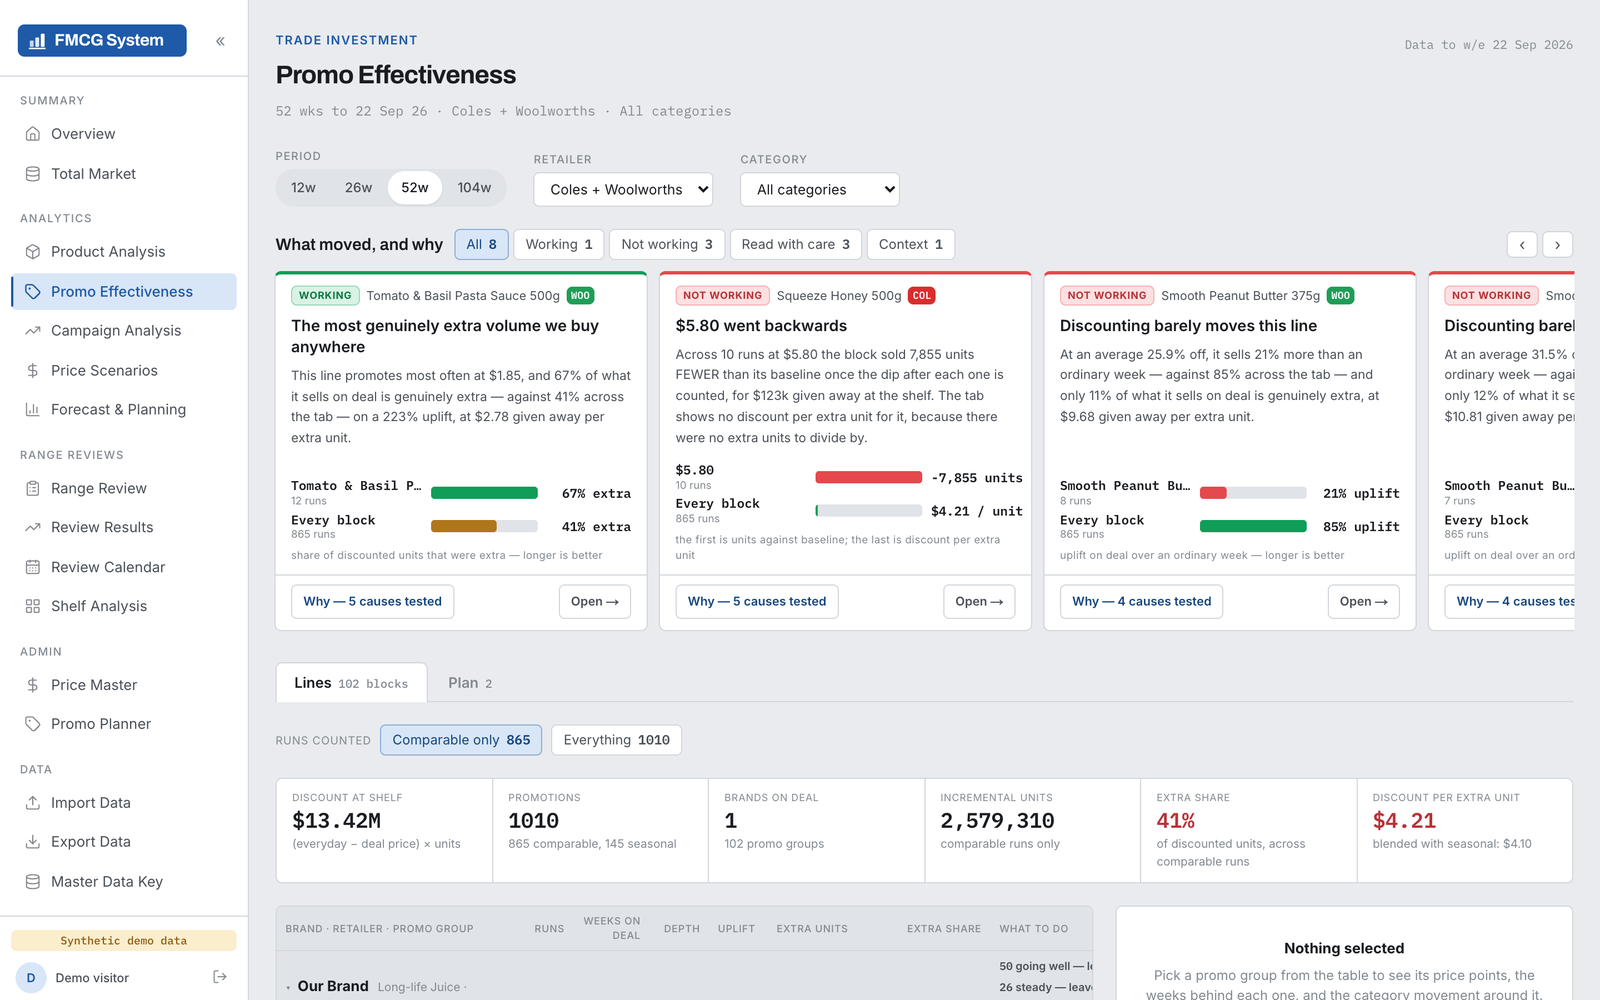
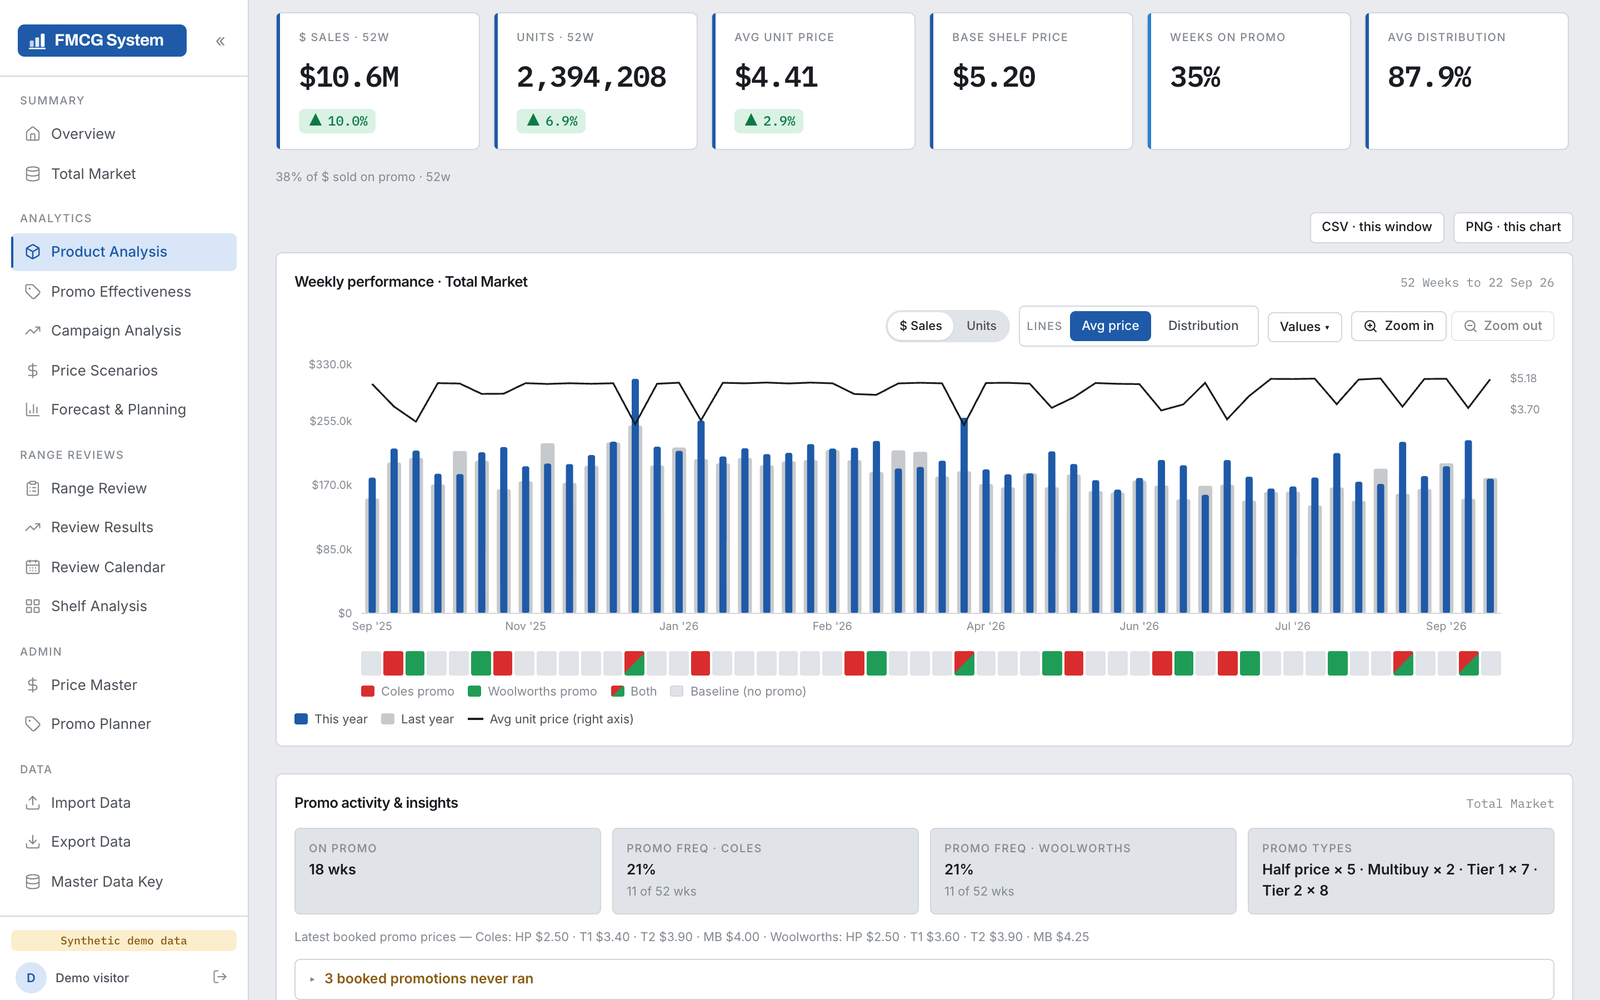
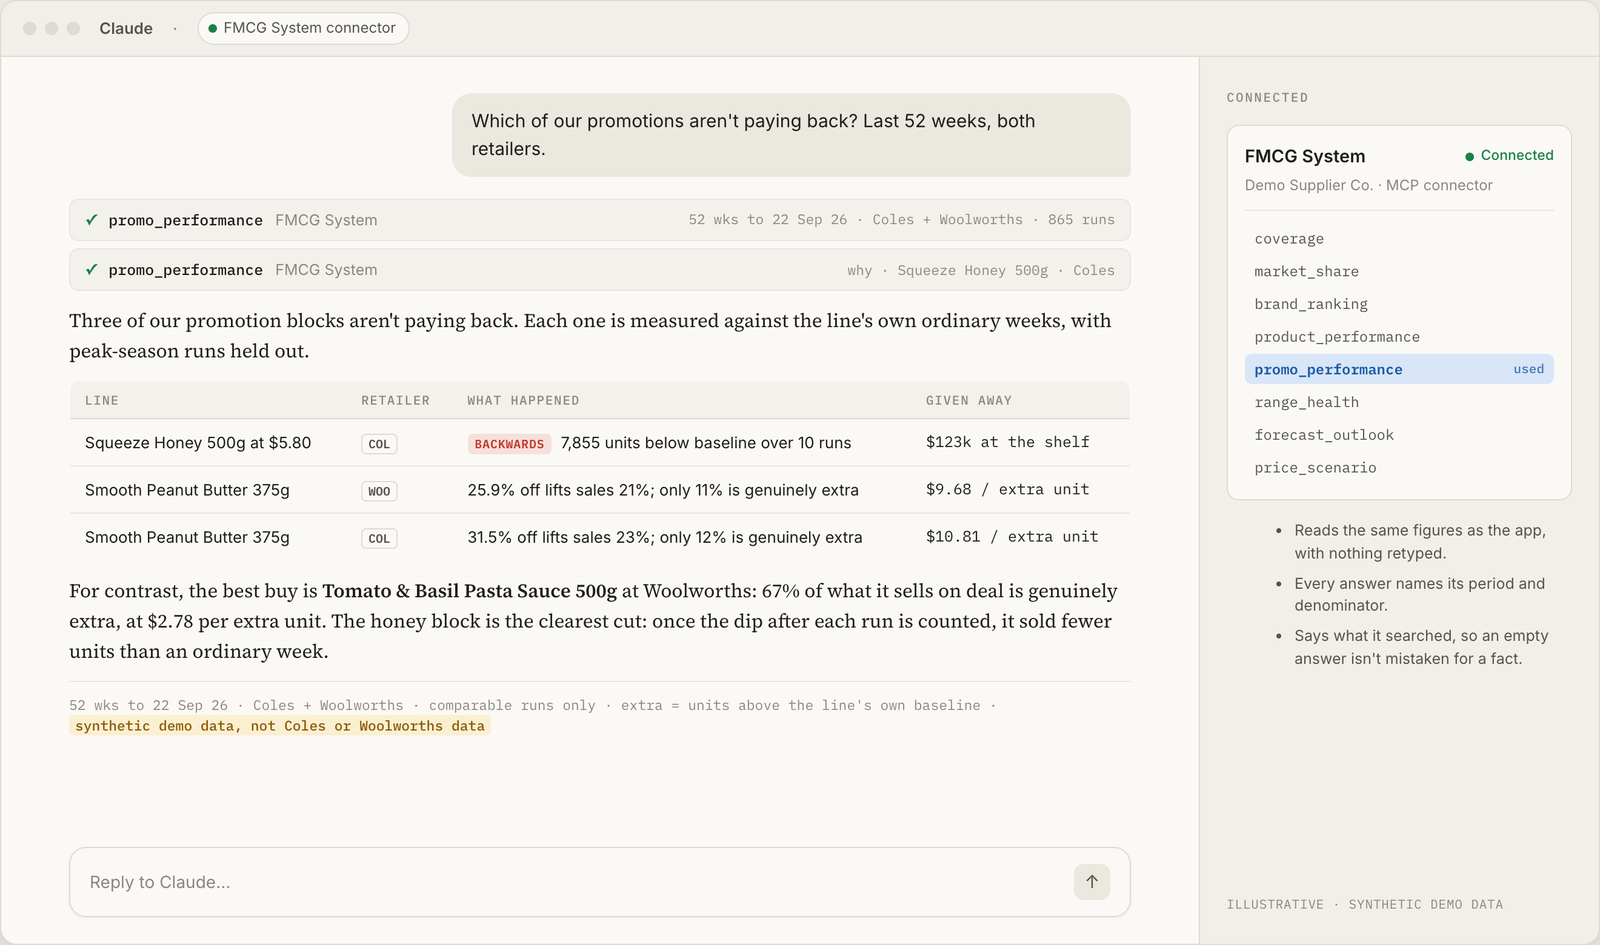
Illustrative interface with synthetic demo data. Retailer names are shown as text only; products are generic. The "Ask the data" view is a design concept. Select a thumbnail to view it above.
We took out the weekly reconciliation. Retailer files auto-classify and check themselves.
We took out the pivot-table drag. One shared view - categories, brands, share.
We took out the guesswork. Every line item, its price, its shelf, its competitors.
We took out the promo-grid pain. Forecasts move as you build the year.
We took out the after-the-fact debate. Advertised regions vs the ones that weren't.
The problem
Category reporting ran on hand-stitched spreadsheets and an ageing internal dashboard. Every week someone reconciled two supermarket chains' scan files into Excel by hand before anyone could look at a number, and answering "how did that promotion actually go?" was a day of pivot tables. Pages that did load took close to a minute, so nobody opened them in a meeting.
What we built
A web platform that takes the weekly retailer scan files, factory shipments and promo plans as they land, classifies and checks them automatically, and turns them into one shared view of the categories. Buyers, brand and supply all work off the same numbers, from a whole-of-market summary down to a single line item's price, shelf presence and the competitors taking its sales. It sits behind the company's existing Microsoft login. We connect the platform to AI models so their reasoning works over the business's own numbers: the team can ask a question in plain English and get consultant-style analysis, recommendations and a clear answer, with the period and the denominator stated every time.
Outcome
A morning → 5 mins
The weekly reconciliation of two retailers' scan files used to eat a full morning. Now it's automatic. Page loads dropped from nearly a minute to under two seconds. Old reporting tool retired. 380,000+ rows of scan history queryable in the browser.